Power BI is a business intelligence platform that enables organizations to analyze data in-depth through interactive visualizations, supporting both self-service and enterprise-wide analytics. In recent years, Power BI has become more and more popular. Nevertheless, it is challenging for power bi consultants to create and manage the optimal solution. Several methods for preserving the necessary optimization in Power BI are covered in this article.
In order to apply performance tuning to Power BI reports, this article will explore techniques for Power BI optimization.

Data Models, ETL, Visualization, and DAX Layers can all benefit from Power BI Optimization:
Power Bi Optimization using Visualization Layer
To optimize Power BI performance, various techniques can be applied to the visualization layer, specifically within Power BI reports. Some of these techniques include:
Limit Visuals on Power BI Report
The Power BI report should have as few visuals as possible. As an alternative, use the Tooltip and Drill through features.
Limit Data by Applying Filters
Use the most restrictive filters on a page or visual level, such as today, yesterday, current week, etc., for date filters rather than leaving filters with the default values (All) for visuals.
Performance Evaluation of Custom Visuals
Assess the performance impact of custom visuals when they are essential for visualization and no-out-of-the-box (OOTB) visuals can be used as alternatives.
Power BI Paginated Reports
Power BI Paginated Reports are designed to efficiently handle large datasets, particularly when used with Grid or Matrix visuals, and are also optimized for printing and generating PDFs.
Optimize Power BI Report using ETL & Data Model Layer
Power bi-optimization strategies for the ETL and Data Model layers will be covered in this section.
DE normalize Data with Star Schema
The initial optimization that is applied to a data model is called denormalization. When the engine moves the filter from one table to another, each relationship has a memory cost and an extra overhead.
The STAR Schema should be taken into account when developing the data model in order to improve performance.
Limit Data Model
Reducing the number of columns needed for analysis or to establish a relationship with other tables in the model is the quickest method to optimize the Power BI data model.
Optimize Column Data Type
Numeric columns inherently offer better performance due to their value encoding, whereas text and non-numeric columns rely on hash encoding, which can be slower. To optimize performance, consider converting text columns to numeric types when feasible, such as replacing “True” and “False” text values with 0 and 1, respectively.
Data Precision
Store data in required precision only, e.g., if the analysis is required on a minute level, then you can save memory by removing seconds and milliseconds from the time column.
Split Column to reduce Data Dictionary
Splitting columns can be an effective way to reduce data dictionary size, leading to a more optimized data model. A common example is the DateTime column, which can be split into separate Date and Time columns for improved efficiency. If time isn’t necessary, converting the DateTime column to a Date column alone can also achieve optimization.
Reduce Dimension Cardinality
To optimize your data model, focus on reducing dimension cardinality. If you have a large number of records (e.g., over 1 million customers), identify attributes with low cardinality that are still essential for analysis. Create a separate dimension for these select attributes to improve efficiency.
Aggregate Tables for Larger Facts
Create aggregate tables at different granularities for facts with billions of rows.
Table Partitioning
Partition large fact tables into smaller segments (ideally 8 million rows or fewer) for better performance, especially with Power BI Premium or Azure Analysis Services.
Optimize Power BI Report using DAX
Boost Power BI performance by optimizing DAX formulas. DAX is the core of Power BI, and refining it can resolve most performance issues. The following list of Dax examples can be utilized in Power BI Optimization solutions at the DAX layer:
Use of Divide Function
Instead of using “/” with IF statements to validate denominators, use the optimized DIVIDE function for division.
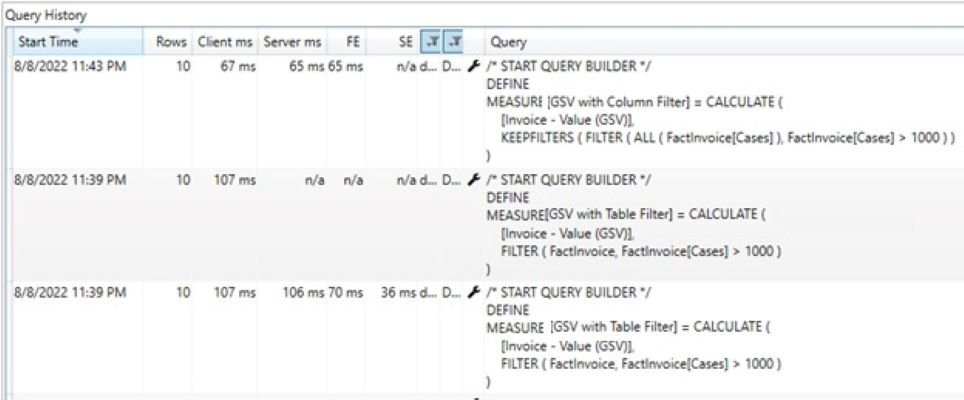
Use of Filter Conditions
Filter CALCULATE/CALCULATETABLE functions using columns instead of tables for better performance.
Reducing Context Transitions
Only simpler groupings, like aggregations and grouping over columns, can be computed by the storage engine; all other calculations are handled by Formula Engine. Assume that the expression that the storage engine computes during the iteration is straightforward. Performance is usually good in that scenario; otherwise, a large data cache and/or a high CallbackDataID frequency may occur. A call between the formula engine and the storage engine is called CallbackDataID. CallbackDataID can cause the storage engine to execute more slowly and prevent the generated data cache from using the storage engine cache. The query execution can be optimized by removing this.
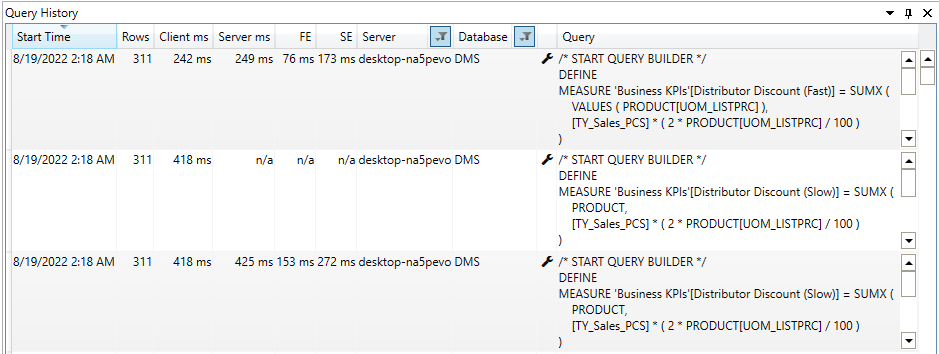
The “Distributor Discount [Slow]” measure is slow due to frequent transitions between the Storage Engine (SE) and Formula Engine (FE) for each row in the product table.
In contrast, the “Distributor Discount [Fast]” measure optimizes performance by reducing transitions to only distinct values of the DimProduct[UOM_LISTPRC] column, resulting in a 42% performance gain.
Use of Variable (VAR) to Avoid Multiple Evaluation
It is a good idea to store the result of the sub-expression in a variable and indicate the variable in DAX Expression when the same sub-expression needs to be evaluated more than once. Using variables is a best practice that enhances code performance and readability while also assisting developers in troubleshooting issues.
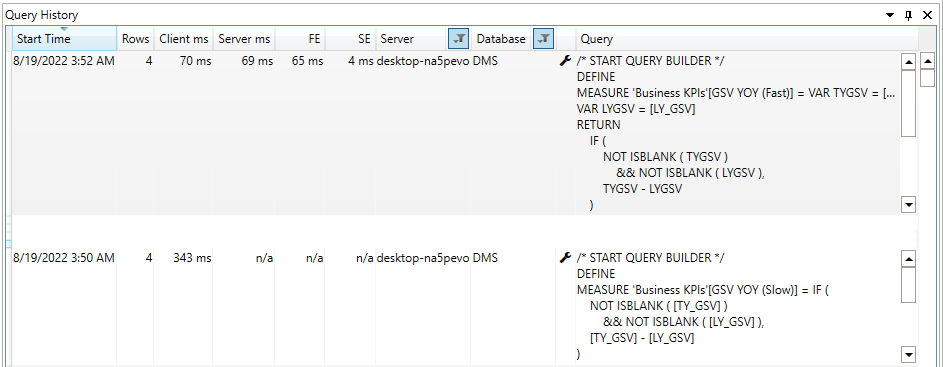
Using “VAR” to compute the YOY measure in the example above yields an 80% performance.
Avoid Nested Iterators
When DAX contains nested iterators, only the innermost iterator can be run in a single storage engine query. We should use summarize and other functions to try to reduce the number of nested iterators because the outer iterators need more storage queries or larger materialization.
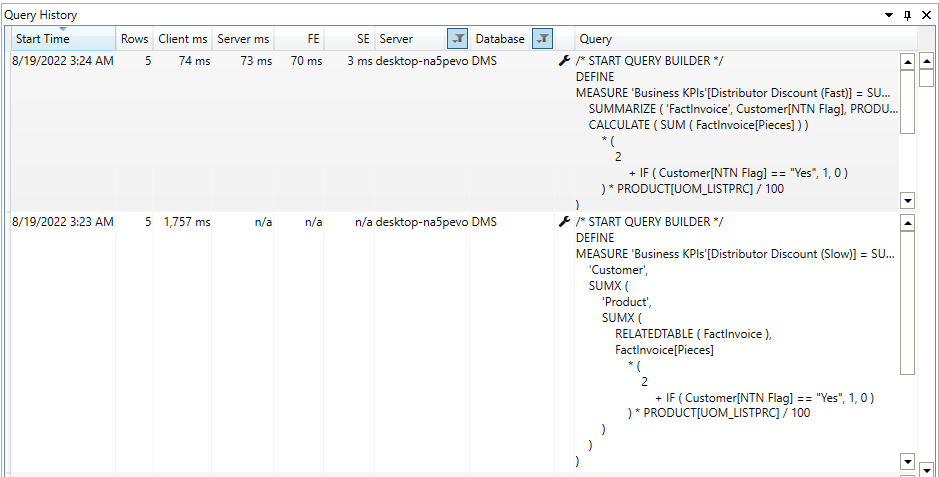
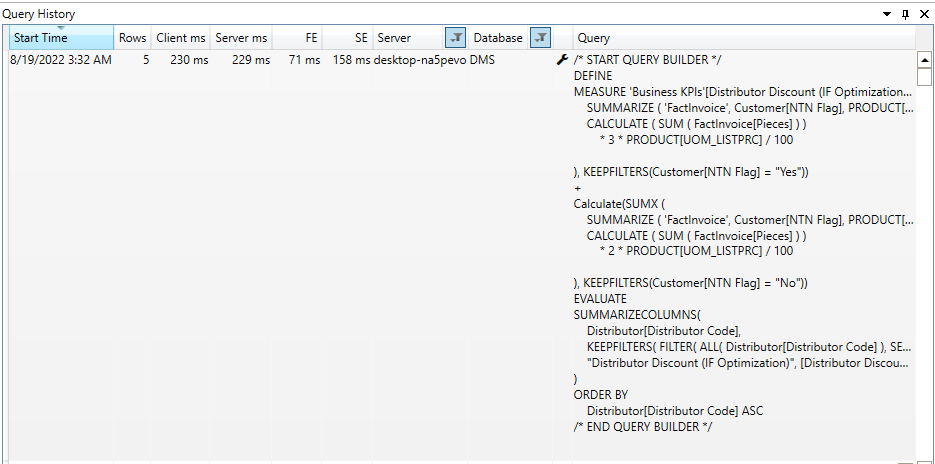
In the “Distributor Discount (Slow)” measure, we use nested Dax operators to obtain the distributor discount; in the “Distributor Discount (Fast)” measure, we use the Summarize function to remove the nested iterators and achieve 99% faster execution. Please be aware that the number of records in the dimensions, fact table, and applied filters may alter this percentage for your data mart.
Avoid IF in Iterators
A larger iterator should not use the IF statement because it will exchange calls between the storage and formula engines, which could be costly for the execution of the query as a whole. Please be aware that FE always performs the “IF” function.
In the earlier example, we evaluated the Dax expression using the “IF” statement. We changed the logic in the aforementioned example to eliminate the “IF” statement. Please take note that the example above has a longer execution time. Nevertheless, we should attempt to remove the “IF” statement, compare the outcomes based on various criteria, and make a decision after that.
Take a look at our other blogs that may be of assistance: